
Over the years, Microsoft has gained momentum as they have come up with new analytics now and then. Recently, they have decided to bridge the gap between data and decision-making and have introduced Power BI or Business Intelligence into the market for the better working of executives, managers, and others to ensure informed business decisions.
If you are a beginner and would like to work with a Power BI solution provider in the USA like Techcronus, which is not only into providing data analytics and reporting but also into consulting, then this article is for you. Here, we will provide a guide on Power BI.
What is Power BI?
If you want to create analytics reports and an interactive dashboard, Power BI is the best solution that you can have. It is a business intelligence software and data visualization tool that converts data sources and prepares analytical reports and interactive dashboards.
Different Power BI versions are used for operating in various platforms like mobile Power BI, desktop Power BI and SaaS Power BI. With Power BI, one can get many services and connectors for business intelligence. For example, with Microsoft Excel being its foundation, anyone who knows Excel can efficiently work on Microsoft Power BI.
Elements of Power BI
There are several elements of Power BI that function together. However, the three essential elements that operate at the primary level are as follows:
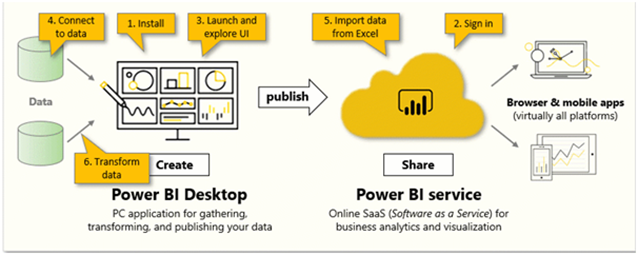
(Reference: 360 Reports- https://360reports.io/author/360reports-io/page/4/)
1. Power BI Desktop – It is a Windows desktop application
2. Power BI Service – It is an online SaaS service
3. Power BI mobile apps – These are for windows, iOS, and other android devices
Apart from these three elements, Power BI works on two other essential components:
1. Power BI report builder – for creating reports to be shared
2. Power BI report server – for publishing reports after making them
Purposes of Power BI
According to Microsoft, the purpose of using Power BI is as follows:
a. To develop a smooth data experience
With Power BI, you can easily connect and view personalized analytical reports without having to compromise with your brand and KPIs. Moreover, your business queries can be solved with fast and AI-driven answers, even if it demands to be answered in a different language.
b. To gain insights from your largest BI deployments
Microsoft’s Power BI has allowed you to connect with your data sources to analyze, promote, and share insights across your organization to make optimum use of your data investments. While doing so, you do not have to worry about your data’s accuracy, security, and consistency. Instead, all of them will remain intact.
c. Helps to make decisions confidently
While working on other Microsoft Office platforms, you can collaborate, share and work together with the same data and enrich every one of your organizations with the same information at the same time to make data-driven decisions quickly and strategically.
Besides the three primary purposes as mentioned above, there are other purposes of Power BI as stated below:
- Pre-built reports and dashboards for SaaS solution
- Real-time dashboard updates
- Uses natural language query to allow data exploration
- Offers hybrid configuration, quick deployment, and secured environment
- Builds reliable and secured connection with data sources
What does Power BI do?
The main work that Power BI does is to prepare reports and insights based on the company’s data. For connecting to multiple data sets, there is no match to Power BI. All the information is better fed so that it can be digested and understood well. After the preparation of data and the reports visually, they can be shared with the other users of the organization.
With Power BI, you can see the happenings of the present or the past and get an insight into what may happen in the future. Since Power BI functions on machine learning, it can locate the patterns at which dun functions. Further, it can predict the future of upcoming scenarios. Once you get these estimates beforehand, it will be easier for you to be prepared for future demands and meet them.
Different Tools of Power BI
Some of the critical Power BI tools are as follows:
a. Power BI desktop
Power BI desktop is the elementary tool that authorizes and publishes the data. Developers use it to create reports and models from scratch.
b. Power BI service
This is used to host online Power BI data, models, reports, and dashboards. The data is administered, shared, and collaborated in the cloud.
c. Power BI data gateway
The Power BI data gateway connects an on-premise data source and a Power BI service. Then, the BI Admin installs it.
d. Power BI report server
It can host KPIs, paginated reports, mobile reports, and Power BI desktop reports. The IT team manages and updates this every four months.
e. Power BI mobile apps
As the name suggests, this is for all mobile app platforms like Android, iOS, and Windows. Managing the Power BI mobile apps can be done by using Microsoft Intune. It can allow you to view reports and dashboards.
History of Power BI
As a beginner, you need to have an idea about the history of Power BI. So here are some historical facts about the birth and inception of Power BI:
· Two exponents of Microsoft’s SQL server coverage services team, Ruler and Dhers Netz created the Power BI.
· In 2010, the Power BI was designed by West Chadic George and was named Project Crescent.
· It was joined with SQL Server Codenamed Mount McKinley in 2011.
· Microsoft opened up the first preview of Power Bi in the year 2014.
· On 24th July 2015, the first version of Power BI was released.
Over the years, Power BI gained immense success, and now it is one of the most widely used AI programs by Microsoft. A case study by Kickstarter revealed the success rate of Power BI. In the case study, Kickstarter took a period of 2009 – 2018 to observe the progression. It was noticed that after working on 375K projects, the average success rate per project was 36%. The advance in this case study is represented below in the form of a graphical representation:
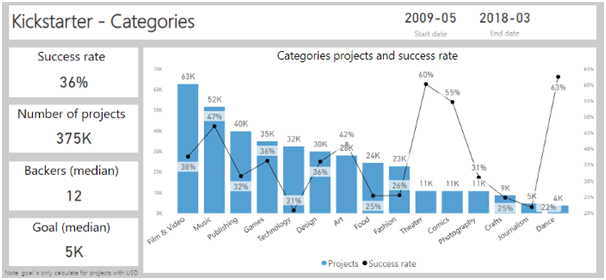
This study inferred that if anyone wants to fund projects catering to the music or art industry that uses Power BI, he can quickly get a success rate of more than 55%. However, the technology projects in this field do not enjoy that much success.
Conclusion
Now that you know the power of Power BI, it can be used by project and portfolio managers, business and data analysts, data scientists, IT professionals, etc. Above all, being backed by artificial intelligence and machine learning, Power BI works wonders.